SEO Reporting
SEO Reporting That Clients Actually Understand

Most SEO reports get opened once, skimmed for thirty seconds, and forgotten. Not because the work behind them was bad. Often it’s the opposite. The campaign is performing well, rankings are climbing, technical issues are getting fixed. But the report itself is speaking a language the client never signed up to learn.
If you’ve ever sent a report full of “domain rating,” “keyword difficulty,” and “crawl budget,” only to get a one-line reply like “looks good, thanks!” then you already know the problem. The client didn’t understand it. They just trusted you enough not to ask.
That trust runs out eventually. Usually right around renewal time, or the moment a new stakeholder joins who wasn’t in the original sales call and asks the obvious question nobody wants to answer: “So what did we actually get for this?”
This is a guide to building SEO reports that clients understand without needing you to explain them, and why that single shift changes how long clients stay.
Case Snapshot
Why Most SEO Reports Fail Before the Client Even Opens Them
The failure usually isn’t in the data. It’s in three decisions made before the report is even built.
1. The report is written for other SEOs, not for the client. Domain authority, backlink velocity, keyword cannibalization are internal diagnostic terms. They’re useful for you to decide what to do next. They mean almost nothing to a business owner trying to figure out if the money they’re spending is working.
2. The report leads with activity instead of outcomes. “We published 8 blog posts, built 12 backlinks, and fixed 40 technical issues” answers “what did you do,” not “did it work.” Clients don’t hire SEOs to do tasks. They hire SEOs to grow the business. A list of tasks completed, without a line connecting it to revenue, traffic, or leads, reads as busywork, even when it isn’t.
3. The report has no narrative. A dashboard full of charts with no story is just noise. Numbers without context don’t tell a client whether they should be worried, excited, or indifferent. Was a 12% traffic dip a problem, or a seasonal dip every business in this space sees every August? The client has no way to know unless you tell them.
The fix isn’t more data. It’s less data, better framed.
What Clients Actually Want to Know
Strip away the SEO jargon and every client is really asking four questions, in this order:
- Is it working? Are we moving in the right direction?
- What changed, and why? What did you do, and what was the result?
- What’s next? What are you doing with what you learned?
- Is this worth what we’re paying? Can I justify this budget to my boss or myself?
If a report answers those four questions clearly, it’s a good report, regardless of how sophisticated the underlying SEO work was. If it doesn’t answer them, no amount of Ahrefs screenshots will save it.
Translate the Metrics, Don’t Just Report Them
The single highest-leverage habit in client reporting is translating every metric into a plain-English sentence about business impact. Not replacing the number, just translating it. Show the number, then say what it means.
| What you’re tempted to report | What the client actually needs to hear |
|---|---|
| “Domain Rating increased from 34 to 41” | “Our site’s overall authority with Google grew, which makes it easier for new pages to rank without as much extra work.” |
| “We acquired 15 referring domains this month” | “15 other reputable websites now link to yours. Each one acts like a vote of trust that helps your whole site rank better, not just one page.” |
| “Organic sessions grew 22% MoM” | “22% more people found you through Google search without us paying for a single click.” |
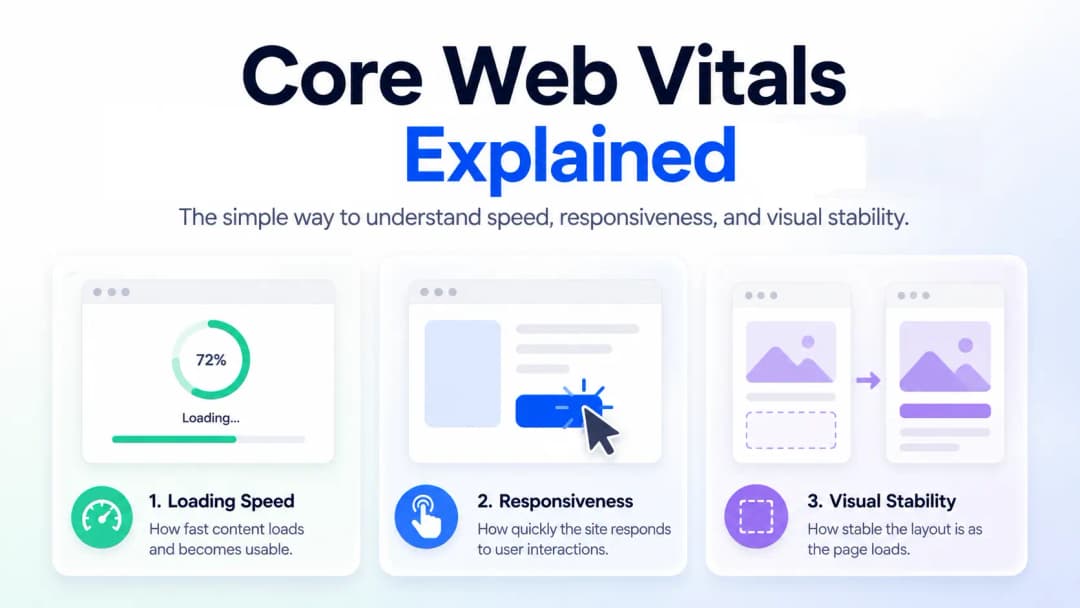
| “Core Web Vitals improved: LCP dropped from 4.1s to 2.3s” | “Your pages now load almost twice as fast. Faster pages keep more visitors from leaving before they see anything, and Google rewards that with better rankings.” |
| “Keyword rankings improved for 34 of 50 tracked terms” | “You’re now showing up higher in search for two-thirds of the terms we’re targeting, meaning more of the right people are seeing you before your competitors.” |
| “Fixed 12 crawl errors and 3 redirect chains” | “We cleared out technical roadblocks that were making it harder for Google to fully understand and index your site. Think of it as clearing debris off a road so traffic can move faster.” |
Notice the pattern: every plain-English version answers “so what does that mean for me?” without the client having to ask. That’s the whole job of a report: doing the interpretation so they don’t have to.
The Anatomy of a Report Clients Understand
A report that works doesn’t need to be long. It needs to be structured around decisions, not data dumps. Here’s a structure that consistently lands well with non-technical stakeholders.
1. The Headline (30 Seconds to Read)
One or two sentences at the very top, before any chart. Something like: “Organic traffic grew 18% this month, driven mainly by the new location pages ranking for local search terms. Leads from organic search are up 3, from 11 to 14.”
This is the sentence that gets read even when nothing else does. If someone forwards this report to their boss without reading past line one, this line needs to carry the whole story.
2. The Business Outcome Section
Traffic, yes, but tied to what the business cares about: leads, form fills, calls, revenue, demo signups. If you’re only reporting traffic and rankings without connecting to a business outcome, you’re leaving the client to do the hardest translation themselves, and most won’t bother.
If GA4 conversion tracking isn’t set up cleanly, fix that before worrying about the report design. No amount of good writing fixes bad or missing attribution data.
3. What We Did, Framed as “Why”
Instead of a bullet list of tasks, group work by the problem it solved. “We rebuilt the location pages because Google wasn’t distinguishing your service area from three nearby cities, and that was capping how many local searches you could show up for.” This reframes deliverables as decisions, which is far more defensible than a checklist.
4. What’s Changed in the Landscape
Algorithm updates, competitor moves, and seasonality: a short note here prevents the client from misreading normal fluctuation as underperformance. If traffic dipped because of a known Google update that hit the whole industry, say so plainly, with a source if you have one. Clients forgive dips they understand. They don’t forgive dips that feel unexplained.
5. What’s Next
Two or three specific priorities for the coming period, tied back to the business outcome section. This is what keeps a report feeling like an ongoing strategy instead of a monthly obligation.
6. The Numbers, for the People Who Want Them
Put the detailed charts and tables after the narrative, not before it. Some stakeholders, often a marketing manager and sometimes a technical cofounder, will want to dig in. Give them the depth, but let the decision-makers stop reading after section one and still walk away informed.
Visualizing Data So It Reads Itself
A chart should be understandable without the surrounding text. A few practical rules:
- Trend lines beat tables for anything a non-technical reader must interpret at a glance. A rising or falling line communicates direction instantly; a table of numbers requires math the reader won’t do.
- Annotate the chart, don’t just caption it. A small callout sitting right at the dip, reading “Google Core Update rolled out here,” does more work than a paragraph three inches below.
- Compare against something. “340 organic sessions” means nothing. “340 organic sessions, up from 280 last month, and above our 300/month target” means everything.
- Cap it at one message per chart. If you want to compare five things, that’s five small charts, not one crowded one.
- Use color with intent, not decoration. Green for on target, amber for watch this, red for needs a conversation. Once a client learns your color logic, they can scan a whole report in ten seconds.
Handling Bad Months Without Losing Trust
Every account has a bad month eventually: a core update, a site migration gone sideways, a seasonal dip, a competitor’s aggressive push. How you report it matters more than the dip itself.
The instinct to bury or soften bad news is understandable and almost always backfires. Clients who find out later that a dip was known and unreported lose trust far faster than clients who were told plainly and given a plan.
- State it plainly, first. “Organic traffic declined 14% this month.” Not buried in paragraph four.
- Explain the likely cause with confidence calibrated honestly. If you’re not certain, say “likely driven by,” not “caused by.”
- Give the plan. What are you doing about it, and by when will you have a clearer read on whether it’s working?
- Zoom out if it helps. A one-month dip against a rising six-month trend is a different story than a dip against a flat trend, so show the longer view only when it is genuinely reassuring, never as a distraction.
"Clients rarely fire an agency over one bad month. They fire agencies that seem like they didn’t notice, didn’t explain, or didn’t have a plan."
Sachin Pokharel
Matching Format and Cadence to the Client
Not every client wants the same thing, and matching format to how they actually consume information matters as much as the content itself.
- Executives and owners usually want a five-minute read or a five-minute call. A one-page summary with the headline and business outcome sections covers this.
- Marketing managers often want the middle ground: the narrative plus enough “what we did” detail to defend the account internally.
- Technical stakeholders may genuinely want the raw data: crawl stats, Core Web Vitals detail, schema validation results.
Where possible, build one report with the headline and narrative up top and progressively more detail as you scroll, rather than maintaining two entirely separate reports. It’s less maintenance, and it lets each reader self-select how deep they go.
Monthly is standard for most retainer accounts, but the report cadence and the insight cadence don’t have to match. A quick two-line update mid-month, such as “heads up, we’re seeing early positive movement on the pages we just relaunched,” often does more for retention than the eventual full report, because it shows the relationship is active, not just scheduled.
A Simple Test Before You Send Any Report
Before sending, read only the first paragraph and ask: if the client reads nothing else, do they know whether this month went well, why, and what happens next?
If the answer is yes, the rest of the report is supporting detail: useful, but not load-bearing. If the answer is no, no amount of additional charts further down will fix it. Fix the top of the report first.
The Real Purpose of a Report
A report isn’t proof of work. It’s the client’s evidence, in their own language, for why this relationship should continue. Every metric you include should earn its place by answering a question the client actually has, not by demonstrating how much you know.
The agencies that keep clients longest aren’t always the ones with the best rankings. They’re often the ones whose clients can explain, in their own words, exactly what’s happening and why it matters. That clarity is a deliverable in itself, arguably the one that determines whether all the other deliverables get to keep happening.
Frequently Asked Questions
How often should I send SEO reports to clients?
Monthly is the standard for most retainer accounts, but the report cadence and the insight cadence don't have to match. A quick two-line update mid-month when something notable happens, good or bad, often builds more trust than the scheduled report itself, because it shows the relationship is active, not just a box being checked.
What metrics should actually be in a client-facing SEO report?
Fewer than you think. Lead with business outcomes (leads, calls, form fills, revenue), then support them with traffic and ranking data. Skip metrics that only make sense to another SEO, like keyword difficulty or crawl budget, unless the client specifically asks for that depth. If a metric can't be tied to “so what does this mean for my business,” it doesn't belong at the top of the report.
How do I explain a traffic drop without losing the client's trust?
State it plainly and first; don't bury it in paragraph four. Explain the likely cause with honestly calibrated confidence (“likely driven by” rather than “caused by”), then give the plan and timeline for a clearer read. Clients rarely leave over one bad month; they leave when it feels like the agency didn't notice, didn't explain, or didn't have a plan.
Should every client get the same report format?
No. Executives usually want a five-minute read: a headline and business outcome summary. Marketing managers often want that plus enough detail to defend the account internally. Technical stakeholders may want the raw data. Rather than building separate reports, structure one document with the narrative up top and progressively more detail as you scroll, so each reader can stop wherever they've gotten what they need.
What's the single biggest mistake in SEO reporting?
Reporting activity instead of outcomes: listing blog posts published and backlinks built without ever answering whether any of it worked. A simple test: read only the first paragraph of the report. If a client can't tell from that alone whether the month went well, why, and what happens next, the rest of the report won't save it.

Sachin Pokharel
SEO Expert
Sachin Pokharel is an SEO expert based in Kathmandu, Nepal, specializing in search engine optimization, keyword research, and digital marketing strategies. He helps businesses improve online visibility and organic traffic through data-driven SEO techniques.
More Insights